perf内核源码解析
文章目录
本文所演示的内核版本为3.14.69,平台架构为x86架构,主要以通过perf测试进程的内存带宽为例,讲述了在内核的调用过程。
perf用户态使用
在用户态,用户可以调用perf_event_open系统调用来使用perf。
建议读者好好阅读下下面推荐的资料,这样可以对perf_event_open的理解更加深刻些。
- man2 perf_event_open
- perf events self profiling example
- 使用performance counter读取硬件或软件Event
- perf_event_open 设置性能监视
perf event子系统架构
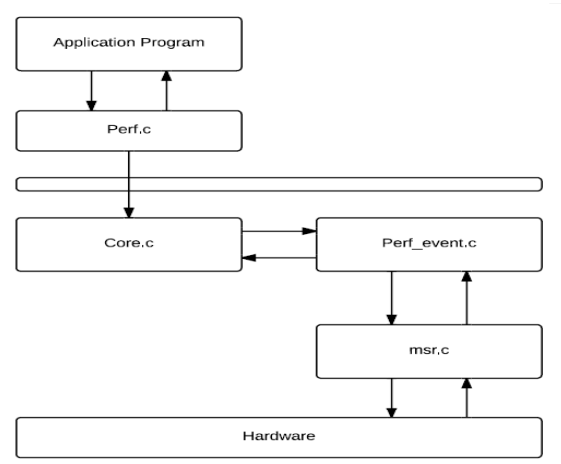
The Linux Perf_Event Subsystem consists of the files core.c and perf_event.c. These files are the interface between the linux kernel and various user space performance monitoring tool.
perf event子系统中的数据结构
数据结构的定义在perf_event.h文件中。
The following are some of the important data structures which are used by the perf_event subsystem.
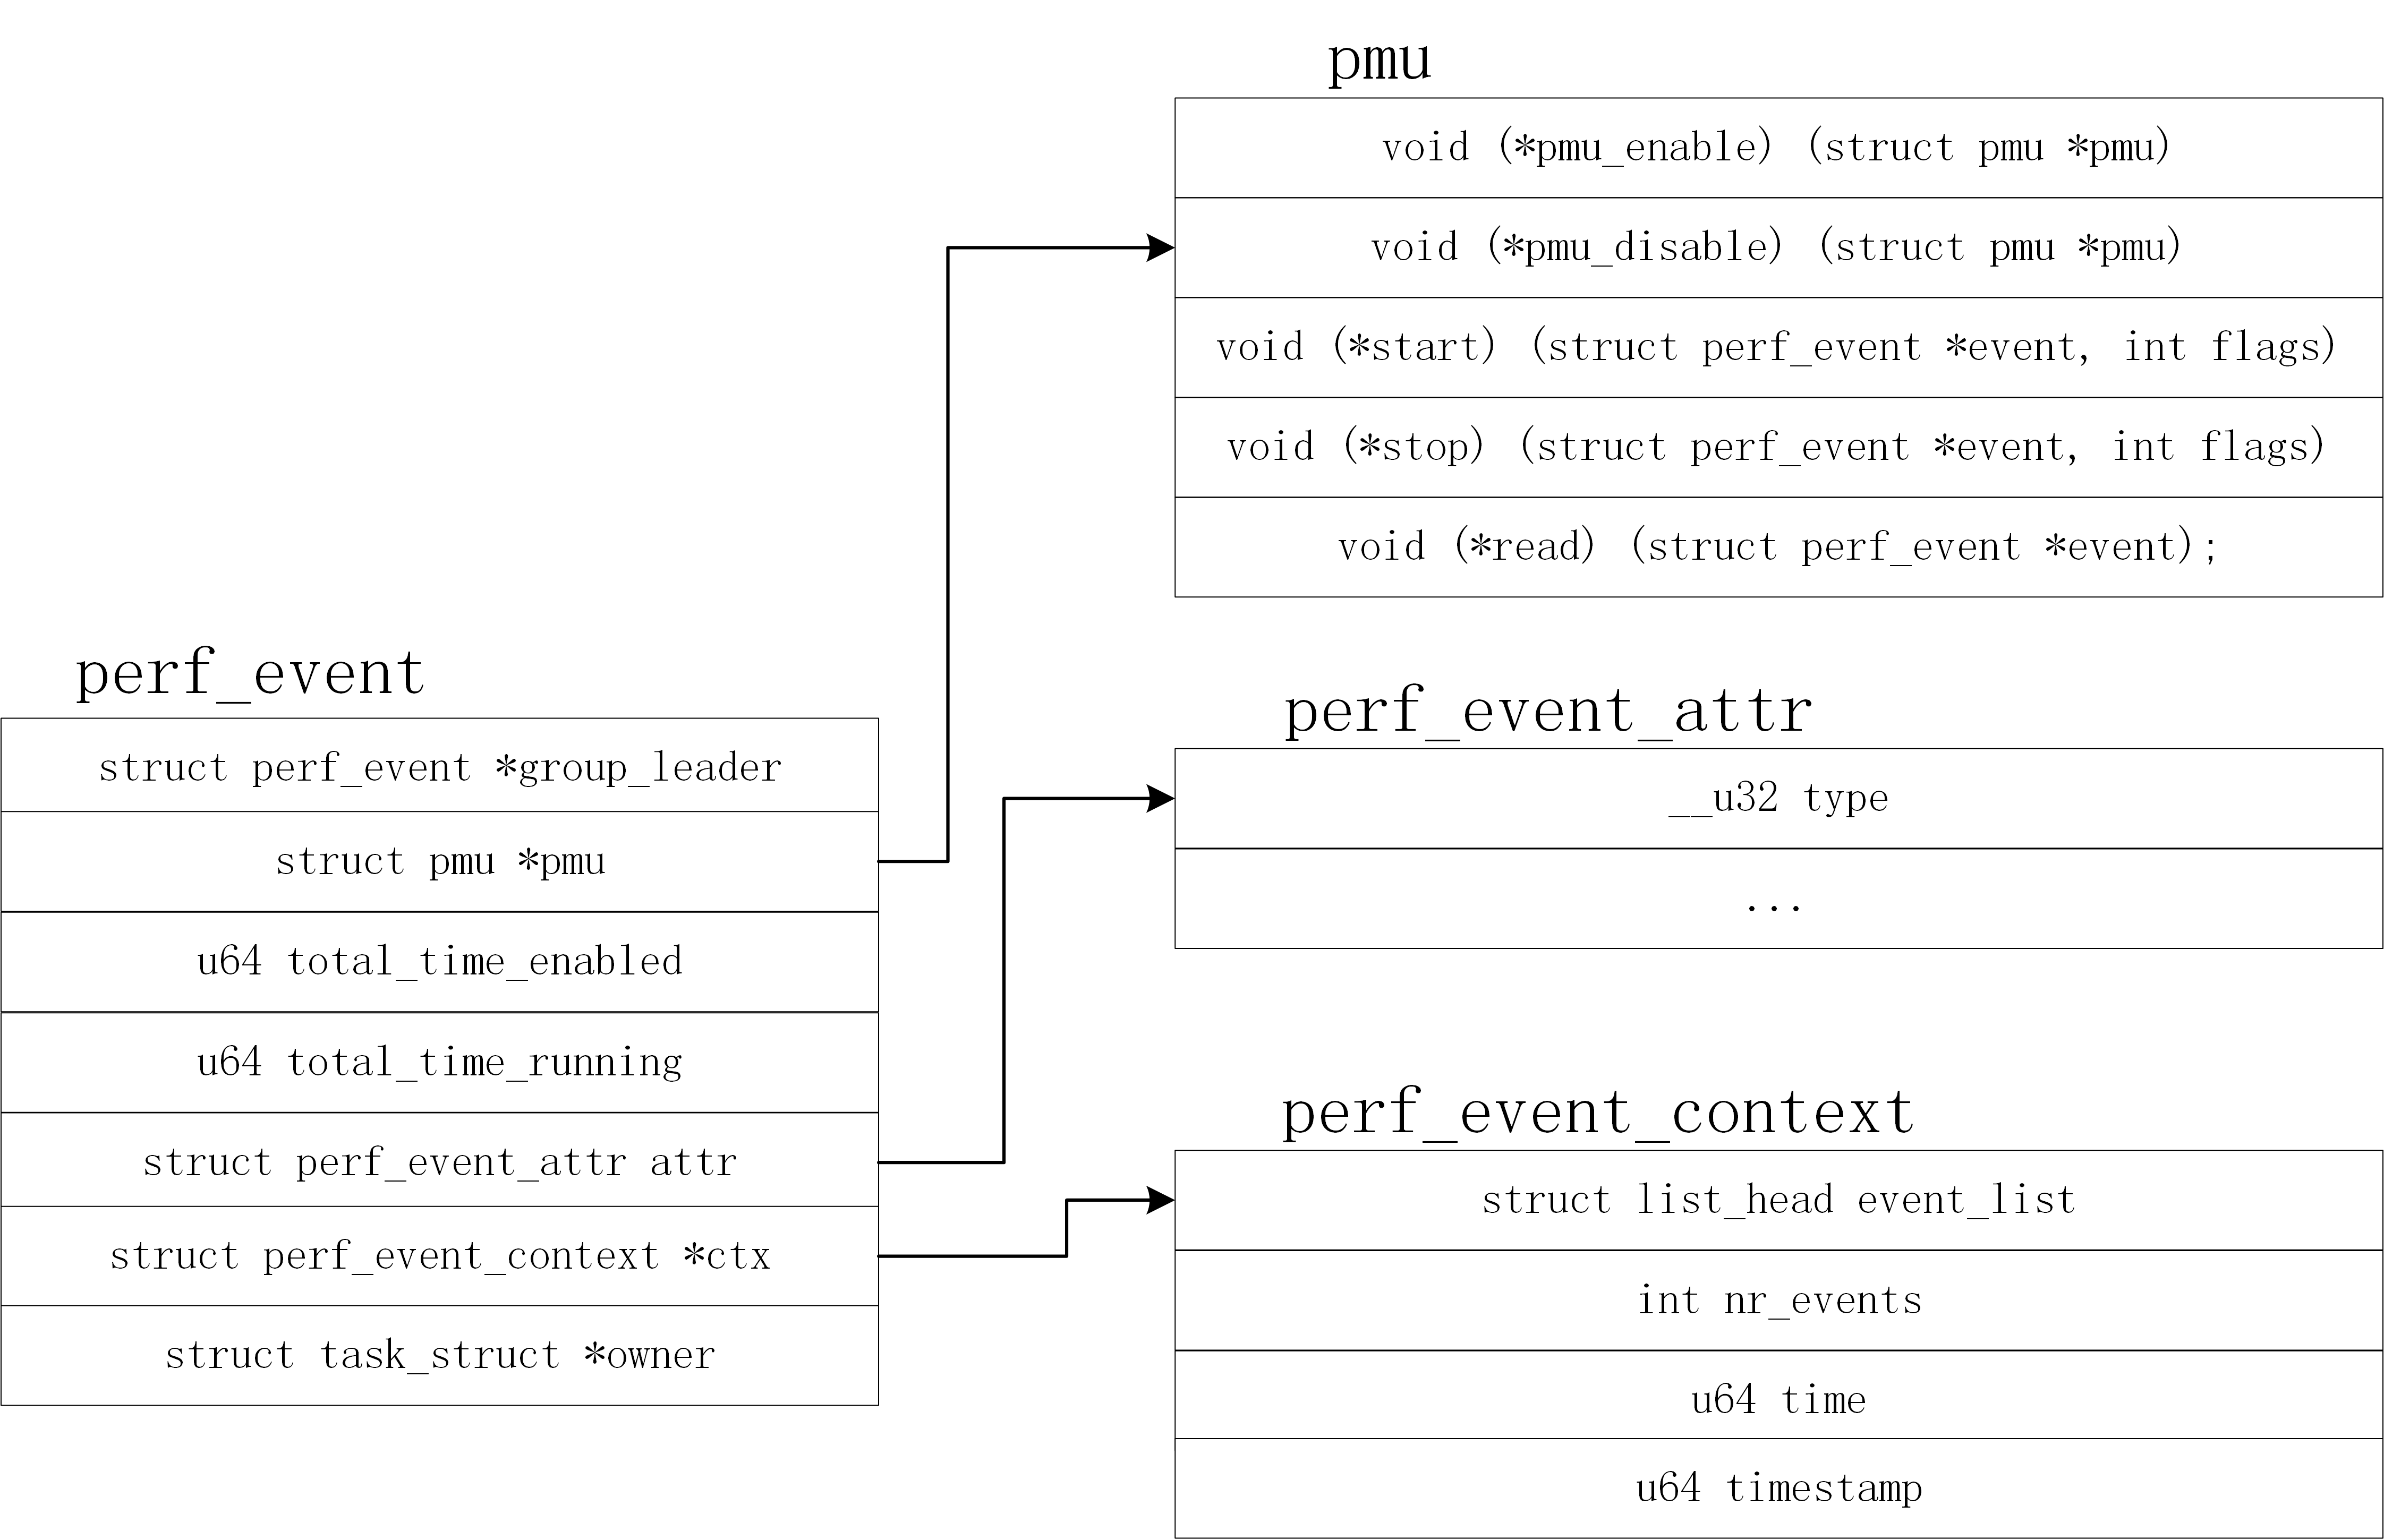
1 | struct perf_event; |
Important Fields in the Data Structures
perf_event
1 | struct perf_event { |
Description:
- group_leader
This field specifies the leader of the group of events attached to the process. - pmu
This field points to the generic performance monitoring unit structure. - total_time_enabled
This field specify the total time in nanoseconds that the event has been enabled. - total_time_running
This field specify total time in nanoseconds that the event is running(scheduled onto the
CPU) - owner
This field points to the task structure of the process which has monitoring this event.
perf_event_attr
1 | struct perf_event_attr { |
Description:
- type
This field specifies the overall event type. - config
This field specifies which event needs to be monitored. It is used along with type to
decide the exact event. - sample_period, sample_freq
Sampling period defines the N value where N is the number of events after which the
interrupt is generated. It can be counted in terms of frequency as well. - sample_type
The various bits in this field specify which values to include in the sample. - exclude_user
This bit when enabled the count excludes the user-space events. - exclude_kernel
This bit when enabled the count exclude the kernel-space events.
perf_event_context
1 | struct perf_event_context { |
Description:
- event_lists
This field specifies the list of events. - nr_events
This field specifies the number of events that are currently monitored. - parent_ctx
This fields points to the context of the processes parent. - time,timestamp
These are context clocks, they run when the context is enabled.
pmu
1 | struct pmu { |
Description:
This structure majorly contains the function pointers to various PMU related functions.
- pmu_enable,pmu_disable
These functions are used to fully disable/enable a PMU. - start,stop
These functions are used to start or stop a counter on a PMU. - read
This function is used to update the event value for a particular counter.
Counting Support in Linux Perf
perf_event assigns one file descriptor per event and either per-thread or per-CPU. The system call perf_event_open() configures the hardware MSRs and creates a file descriptor which can be used for reading the performance measurement data. Once the file descriptor is obtained we can issue subsequent read calls to get the values of the performance counters. These values are then aggregated at the end of the program execution.
The following is the execution flow for getting the file descriptor.
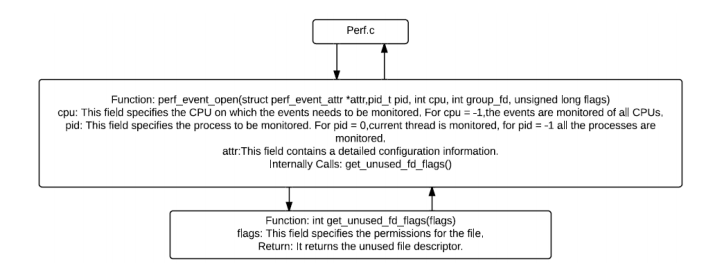
For enabling and disabling performance monitoring events we use the ioclt and prctl system calls.
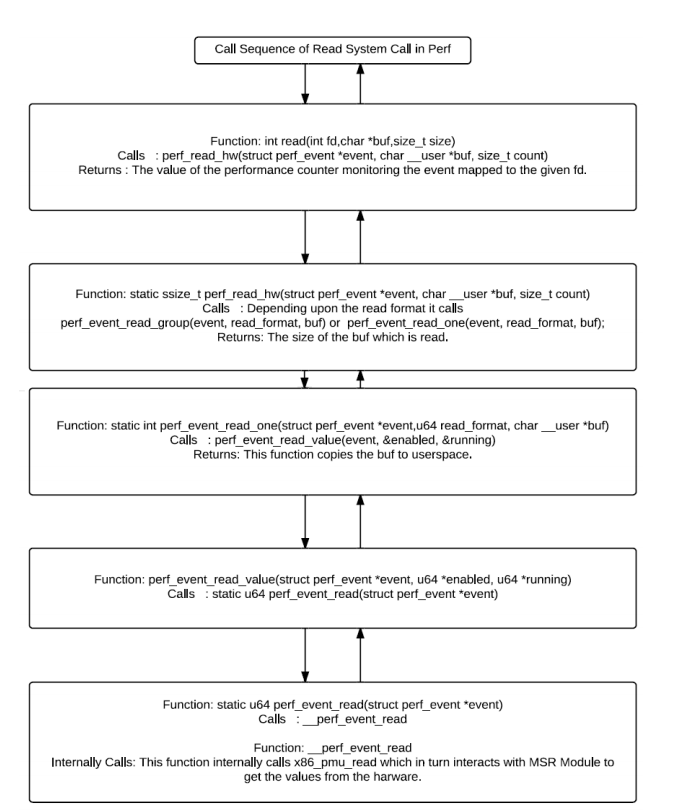
Execution flow of the read system call:
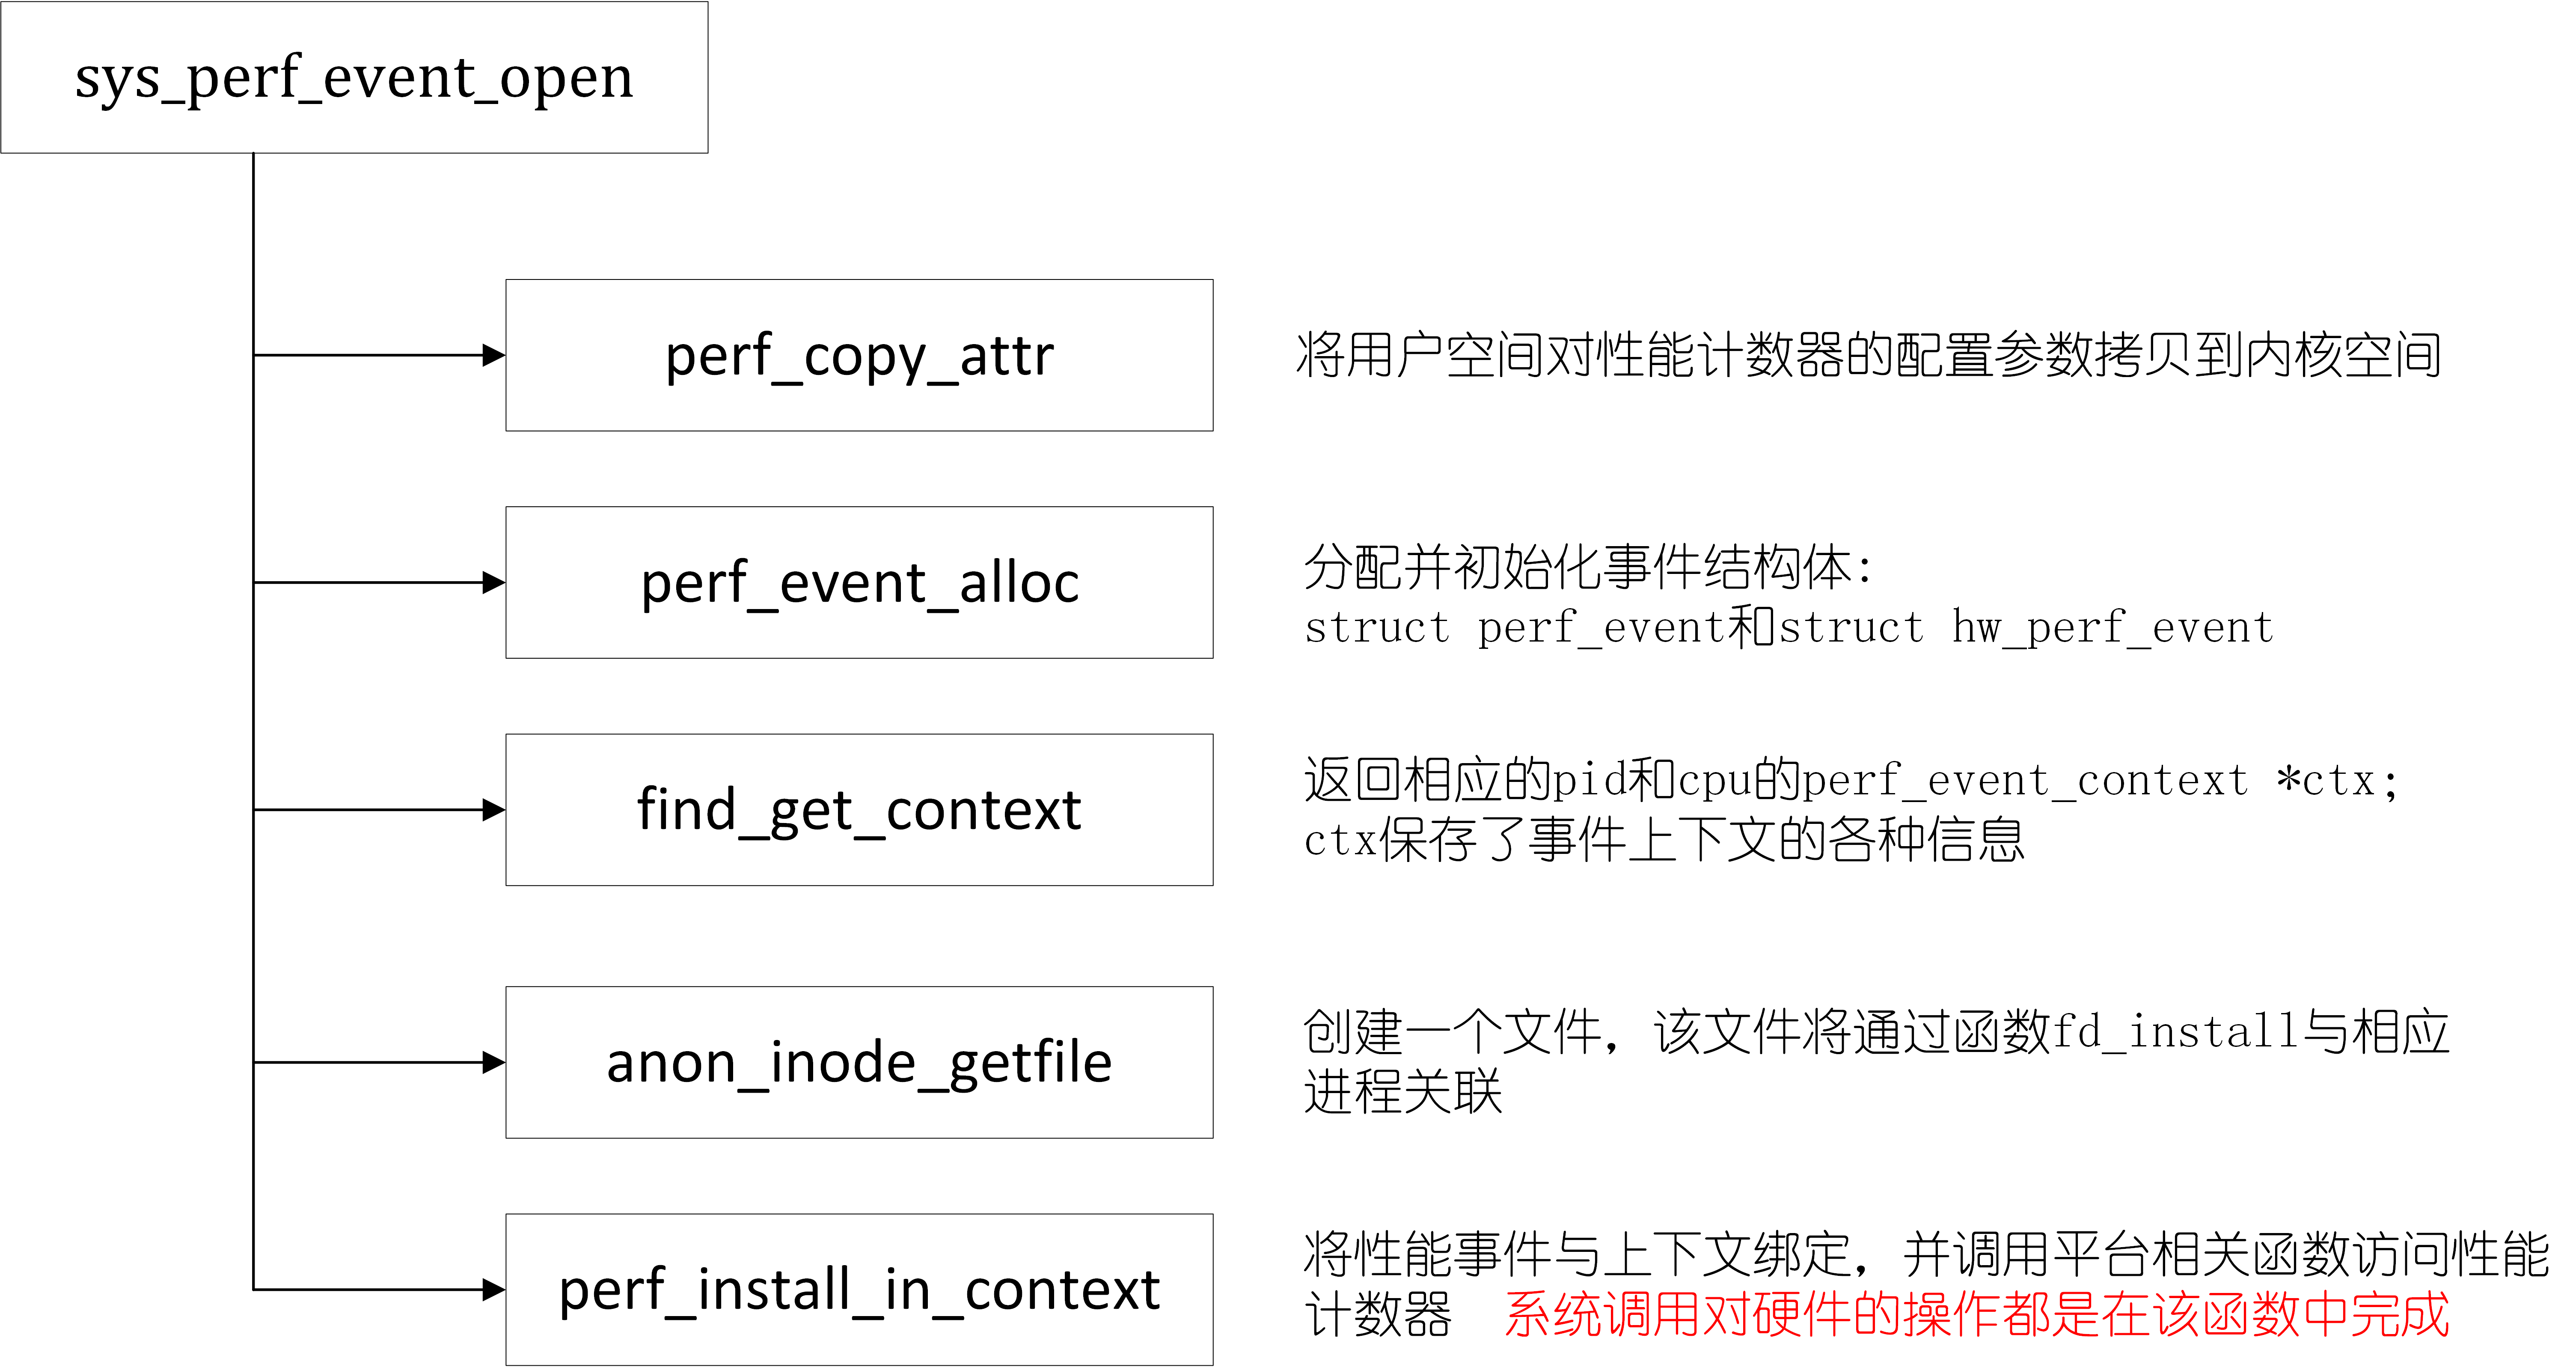
perf_event_open系统调用的具体过程
具体实例
好了,背景知识终于介绍完成了,下面介绍下具体的实例,方便读者理解。perf stat -e cache-misses -I 1000 -p 2234
每隔1000ms,会输出2234进程在过去1000ms的cache_misses硬件事件,这是如何做到的呢?
1 | struct perf_event_attr attr; |
每隔1000ms输出结果是通过用户态程序控制的,阅读完使用performance counter读取硬件或软件Event中的程序即可明白。
当需要监听2234进程的cache_misses时,实际上是对2234进程中的所有线程进行监听,假设线程的数目为5个,此刻,会调用perf_event_open系统调用5次。
1 | static int perf_event_read_one(struct perf_event *event, |
perf_event_read_value会读取相应线程寄存器中记录的cache_miss值。
当统计2234进程时,实际上是对它5个线程的cache_misses值进行累加。假设前2秒内,2234进程的cache_misses为10000,前3秒内,2234进程的cache_misses为30000。那么在2~3秒这一秒内,进程的cache_misses即为20000。
参考资料: