Notes about eBPF
eBPF does to Linux what JavaScript does to HTML. (Sort of.) So instead of a static HTML website, JavaScript lets you define mini programs that run on events like mouse clicks, which are run in a safe virtual machine in the browser. And with eBPF, instead of a fixed kernel, you can now write mini programs that run on events like disk I/O, which are run in a safe virtual machine in the kernel. In reality, eBPF is more like the v8 virtual machine that runs JavaScript, rather than JavaScript itself. eBPF is part of the Linux kernel.
Programming in eBPF directly is incredibly hard, the same as coding in v8 bytecode. But no one codes in v8: they code in JavaScript, or often a framework on top of JavaScript (jQuery, Angular, React, etc). It’s the same with eBPF. People will use it and code in it via frameworks. For tracing, the main ones are bcc and bpftrace. These don’t live in the kernel code base, they live in a Linux Foundation project on github called iovisor.[1]
本文内容转载自:Linux Extended BPF (eBPF) Tracing Tools
1. History
BPF originated as a technology for optimizing packet filters. If you run tcpdump with an expression (matching on a host or port), it gets compiled into optimal BPF bytecode which is executed by an in-kernel sandboxed virtual machine. Extended BPF extended what this BPF virtual machine could do: allowing it to run on events other than packets, and do actions other than filtering.
2. Introduction
eBPF can be used to for software defined networks, DDoS mitigation (early packet drop), improving network performance (eXpress Data Path), intrusion detection, and more. It is used as shown in the following workflow: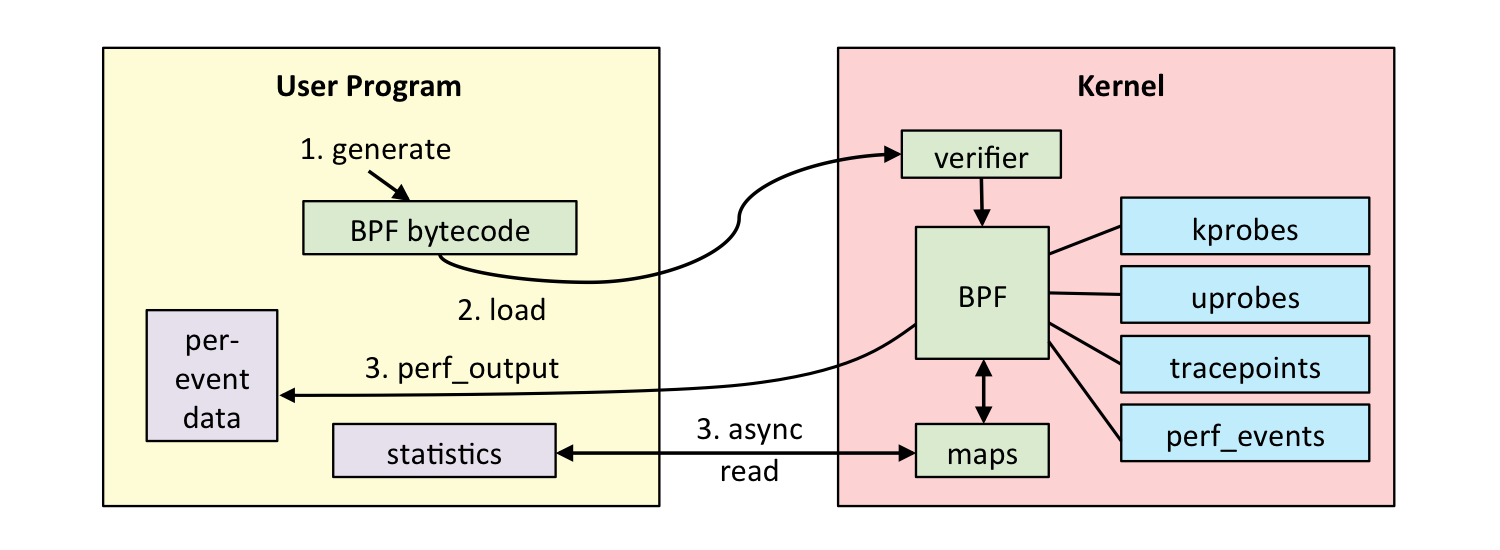
Our observability tool has BPF code to perform certain actions: measure latency, summarize as a histogram, grab stack traces, etc. That BPF code is compiled to BPF byte code and then sent to the kernel, where a verifier may reject it if it is deemed unsafe (which includes not allowing loops or backwards branches). If the BPF bytecode is accepted, it can then be attached to different event sources:
- kprobes: kernel dynamic tracing.
- uprobes: user level dynamic tracing.
- tracepoints: kernel static tracing.
- perf_events: timed sampling and PMCs.
The BPF program has two ways to pass measured data back to user space: either per-event details, or via a BPF map. BPF maps can implement arrays, associative arrays, and histograms, and are suited for passing summary statistics.
3. Prerequisites
A Linux kernel compiled with CONFIG_BPF_SYSCALL (eg, Ubuntu does this), and at least the 4.4 kernel (eg, Ubuntu Xenial) so that histogram, statistic, and per-event tracing is supported. The following diagram shows other features with the Linux version eBPF supported arrived in green: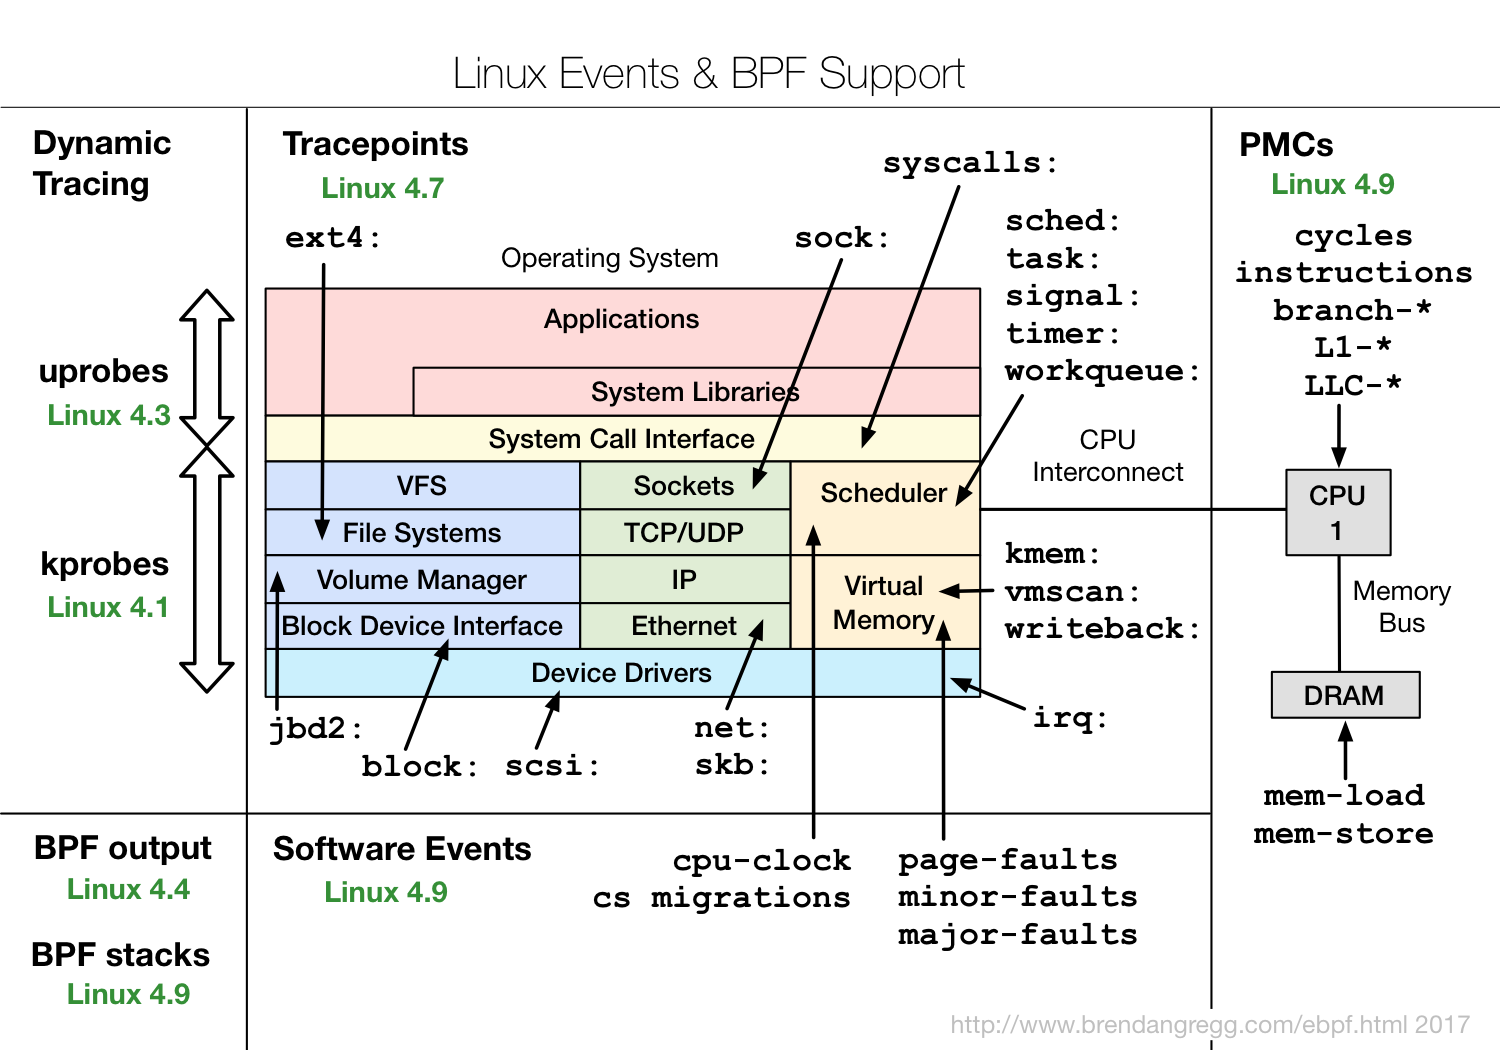
4. Front Ends
There are multiple different front-ends for eBPF. Here’s a summary, I’d recommend trying out bcc and bpftrace (highlighted).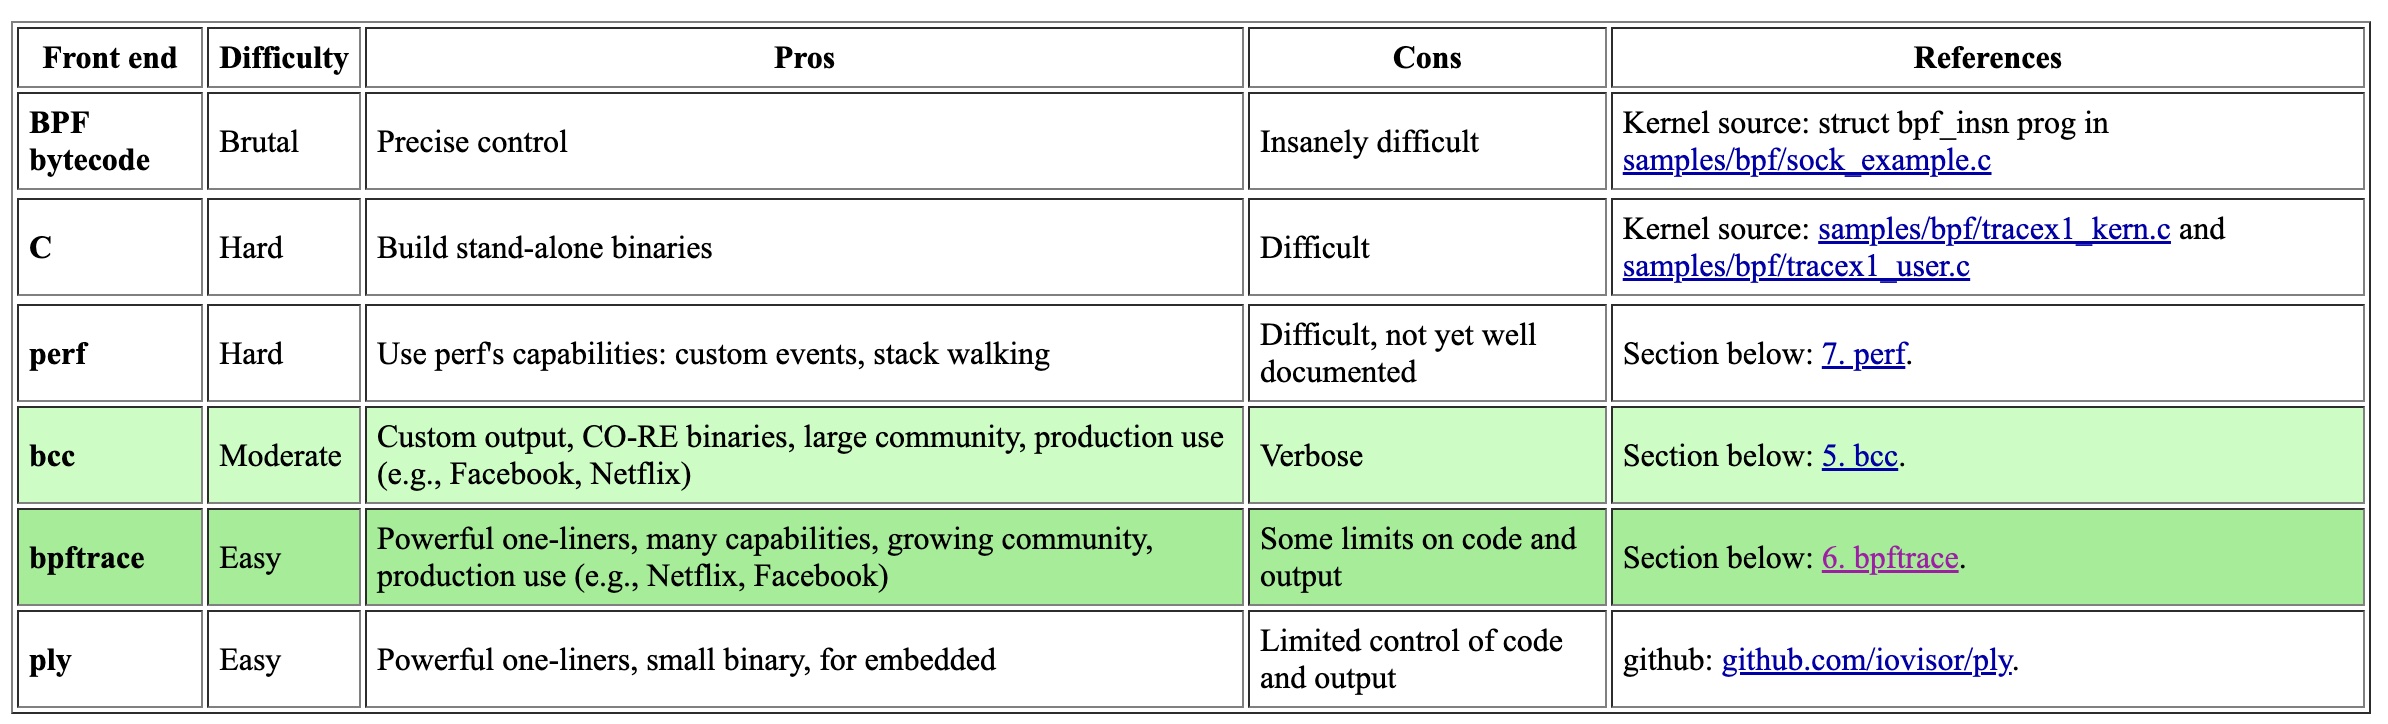
I’ve previously summarized these on three dimensions: ease of use, scope & capability, and stage of development. Here are the BPF front-ends vs the standard built-in Linux tracers (ftrace and perf):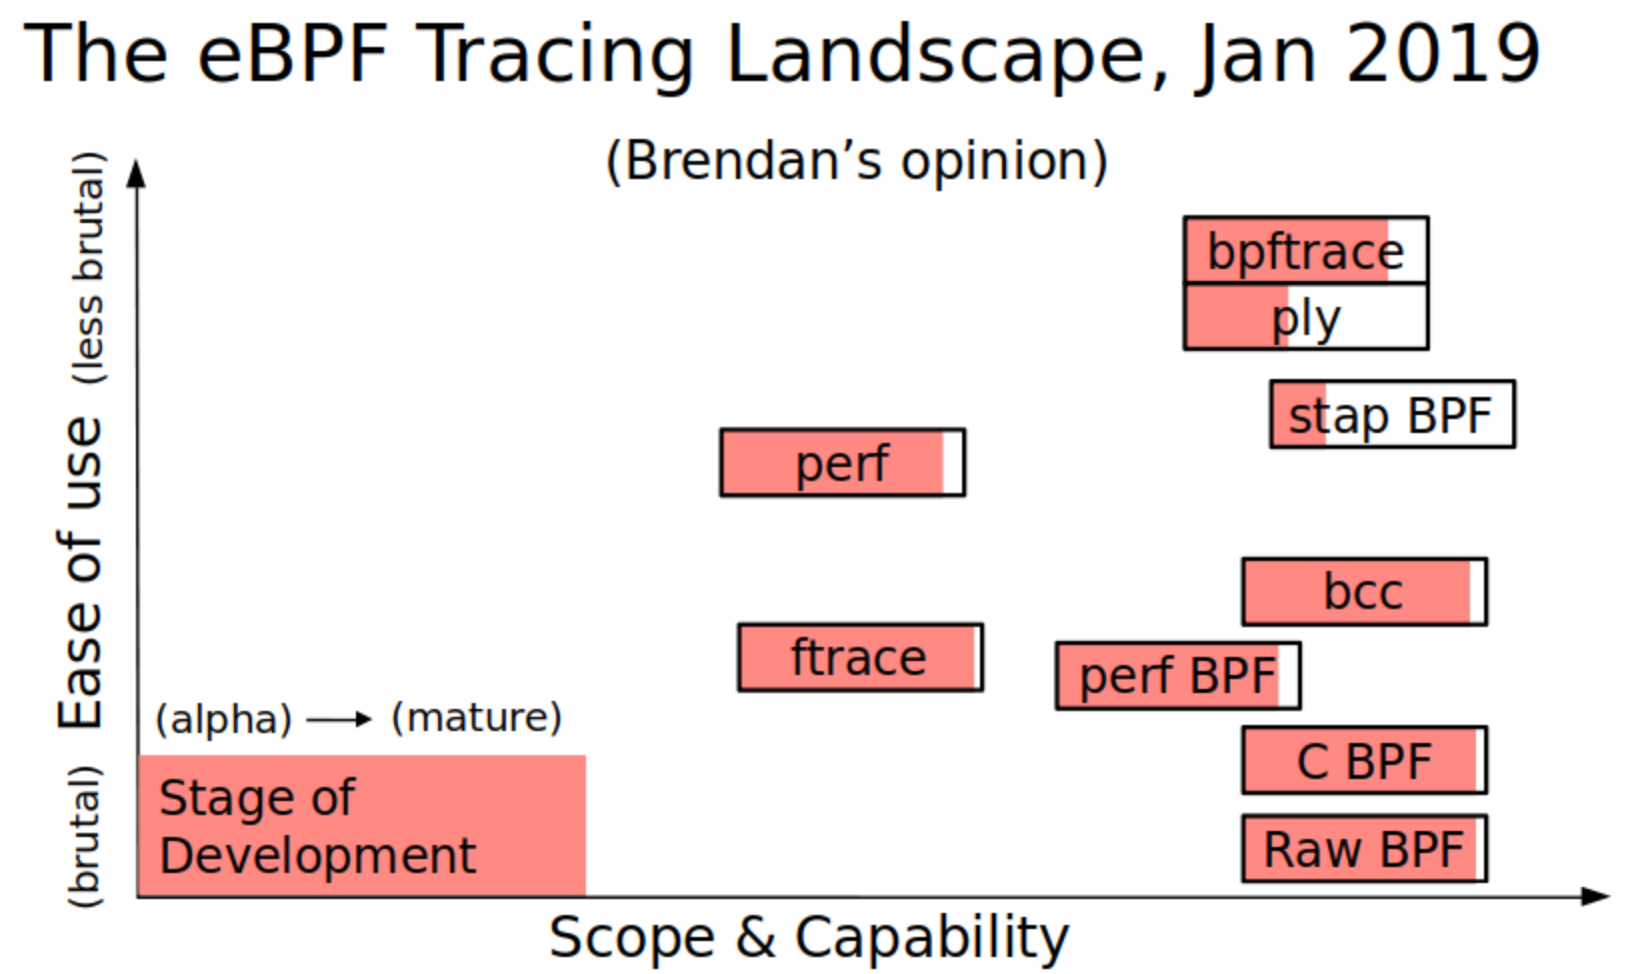
Reference:
[1] https://www.brendangregg.com/blog/2019-01-01/learn-ebpf-tracing.html