Notes about strace
Introduction
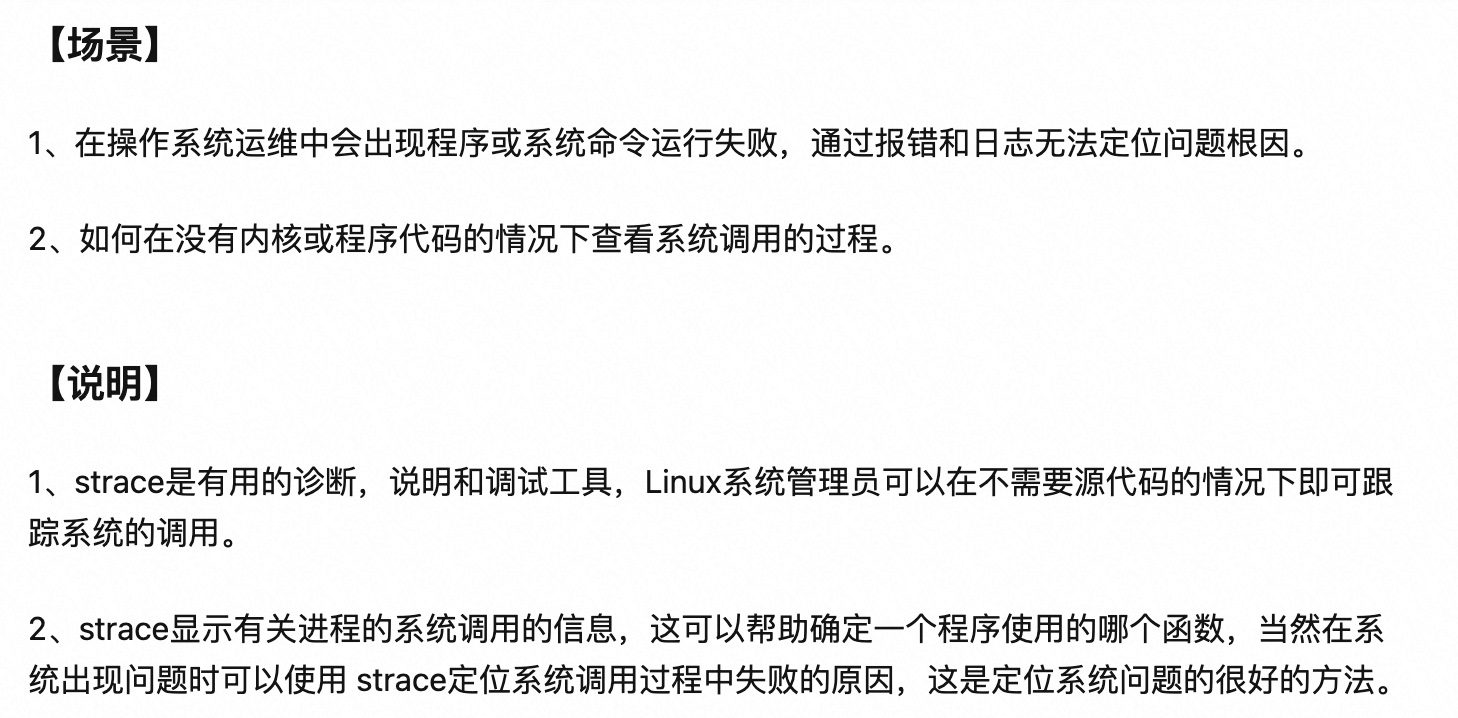
strace is a diagnostic, debugging and instructional userspace utility for Linux. It is used to monitor and tamper with interactions between processes and the Linux kernel, which include system calls, signal deliveries, and changes of process state.
System administrators, diagnosticians and trouble-shooters will find it invaluable for solving problems with programs for which the source is not readily available since they do not need to be recompiled in order to trace them.
The operation of strace is made possible by the kernel feature known as ptrace.
strace解决的问题都是关于寻找程序依赖的文件、找出程序卡住或慢的原因、或者找出程序失败的原因。
资料
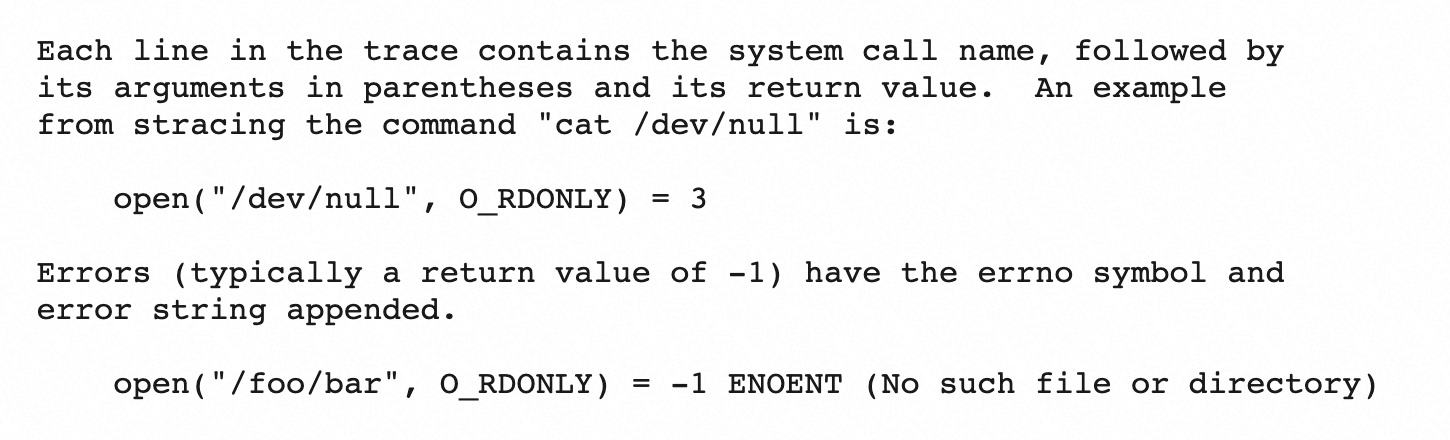
Example
Print stack trace of every system call
-koption is used to print stack trace of every system call.
Print stack trace of every system call-f跟踪目标进程,以及目标进程创建的所有子进程-t在输出中的每一行前加上时间信息(-tt表示微秒级)-T显示每个系统调用所耗的时间-ofilename: Write the trace output to the file filename rather than to stderr.-cCount time, calls, and errors for each system call and report a summary on program exit, suppressing the regular output.
Case
- 手把手教你用Strace诊断问题
- Linux神器strace的使用方法及实践
- strace 可以解决什么问题?
- 配置文件在哪里?
- 这个程序还依赖什么文件?
- 为什么这个程序会挂掉?
- 这个程序卡住了吗?
- 为什么这个程序很慢?
- 隐藏的权限错误
- 正在使用什么命令行参数?
- 为什么这个网络连接失败?
- 为什么这个程序以一种方式运行时成功,以另一种方式运行时失败?
原理
参考资料: