Notes about PMU(Performance Monitoring Unit)
文章目录
本文将mark下PMU(Performance Monitoring Unit)的相关notes,内容源于DSN’12 paper,时效性可能不太准确。
Overview
There are generally two working modes of PMUs: interrupt-based mode and precision mode. In the first mode, a counter will automatically increase and generate an interrupt when it has reached a predefined threshold (i.e., event-based sampling) or predefined time has elapsed (i.e., time-based sampling). This is the basic performance counter mode, which supports most types of events, but lacks precise instruction pointer information, resulting in that the reported IP (instruction pointer) is up to tens of instructions away from the instruction causing the event, due to the out-of-order execution in modern processors. For example, according to AMD’s manual, the reported IP may be up to 72 instructions away from the actual IP causing the event.
To improve the precision and flexibility of PMUs,most commodity processors also support a precise mode of performance monitoring, including the Precise Event-Based Sampling (PEBS), Branch Trace Store (BTS),Last Branch Record (LBR) and Event Filtering (EF). Currently, most existing commodity processors support parts of the features mentioned above.
Precise Performance Counter
In PEBS, the samples of performance counters are written into a preregistered memory region. When the memory region is nearly full, an interrupt is generated to trigger the handler. By batching the samples and processing them together, this mechanism improves the performance of monitoring significantly. Meanwhile, thanks to the atomic-freeze feature, the IP addresses recorded in traces are exactly the ones causing the event.
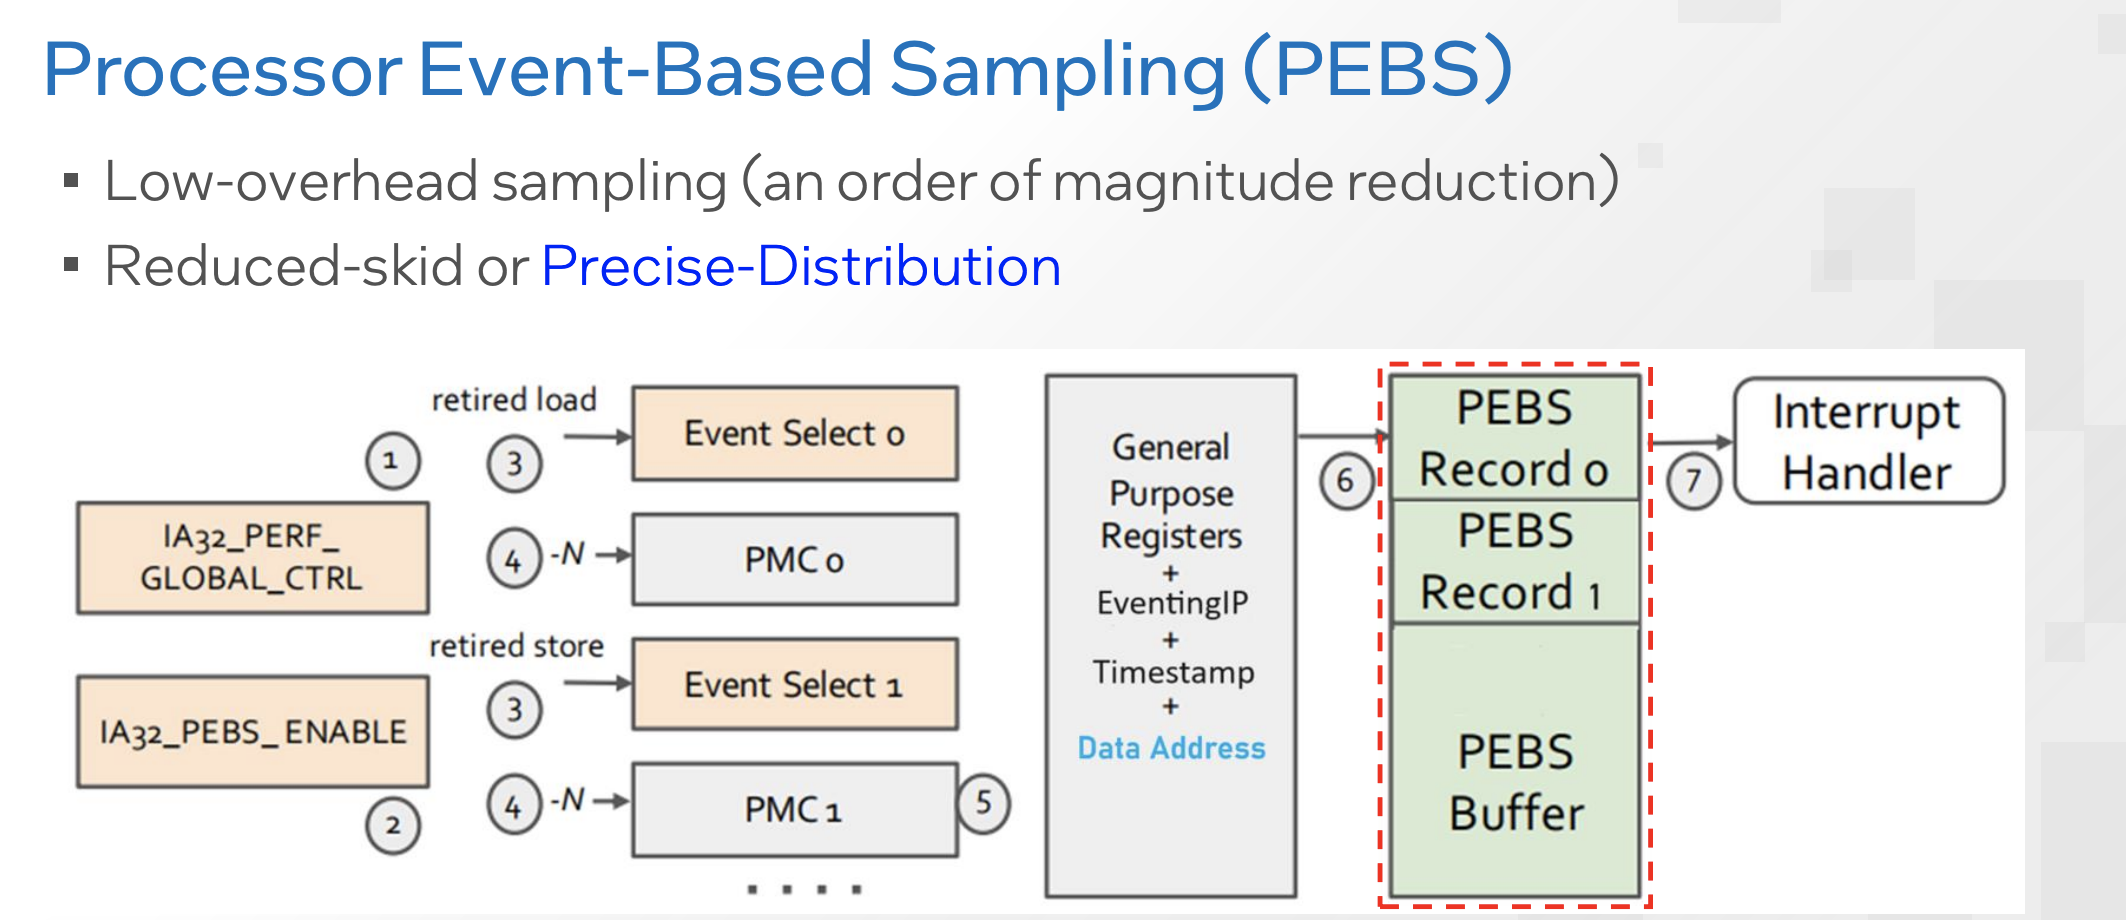
atomic-freeze feature
The PMU atomic-freeze feature is a mechanism in performance monitoring units (specifically Intel processors) that ensures, when a performance event occurs, all counters are frozen simultaneously and precisely at the point of the event. This allows for accurate “Precise Event Based Sampling” (PEBS), ensuring the recorded instruction pointer (IP) corresponds exactly to the instruction causing the event.
Purpose: Enables accurate, precise event-based sampling by preventing the “skid” effect, where performance counters continue to count for a few instructions after an event triggers an interrupt.
Mechanism: When a performance threshold is met, the PMU instantly halts all performance counters, preventing further updates while the event data is written to a buffer.
Application: It is crucial for analyzing cache misses, branch mispredictions, and identifying the exact instruction causing bottlenecks in code execution.
Without this feature, the recorded IP might be several instructions after the actual cause of the event, making performance profiling less precise.
Branch Trace Store
Intel’s BTS mechanism provides the capability of capturing all control transfer events and saving the events in a memory-resident BTS buffer. The events include all types of jump, call, return, interrupt and exception. The recorded information includes the addresses of branch source and target. Thus, it enables the monitoring of the whole control flow of an application. Similar as PEBS, the branch trace is also recorded in a pre-registered memory region, which makes the batching processing possible.
Last Branch Record
LBR in Intel Core and Core i7, records the most recent branches into a register stack. This mechanism records similar data as in BTS. It records the source address and target address of each branch, thus provides the ability to trace the control flow of a program as well. However, due to the small size of the register stack (e.g., Intel Core has 4 pairs, Core i7 has 16 pairs), previous samples may be overwritten by upcoming samples during monitoring.
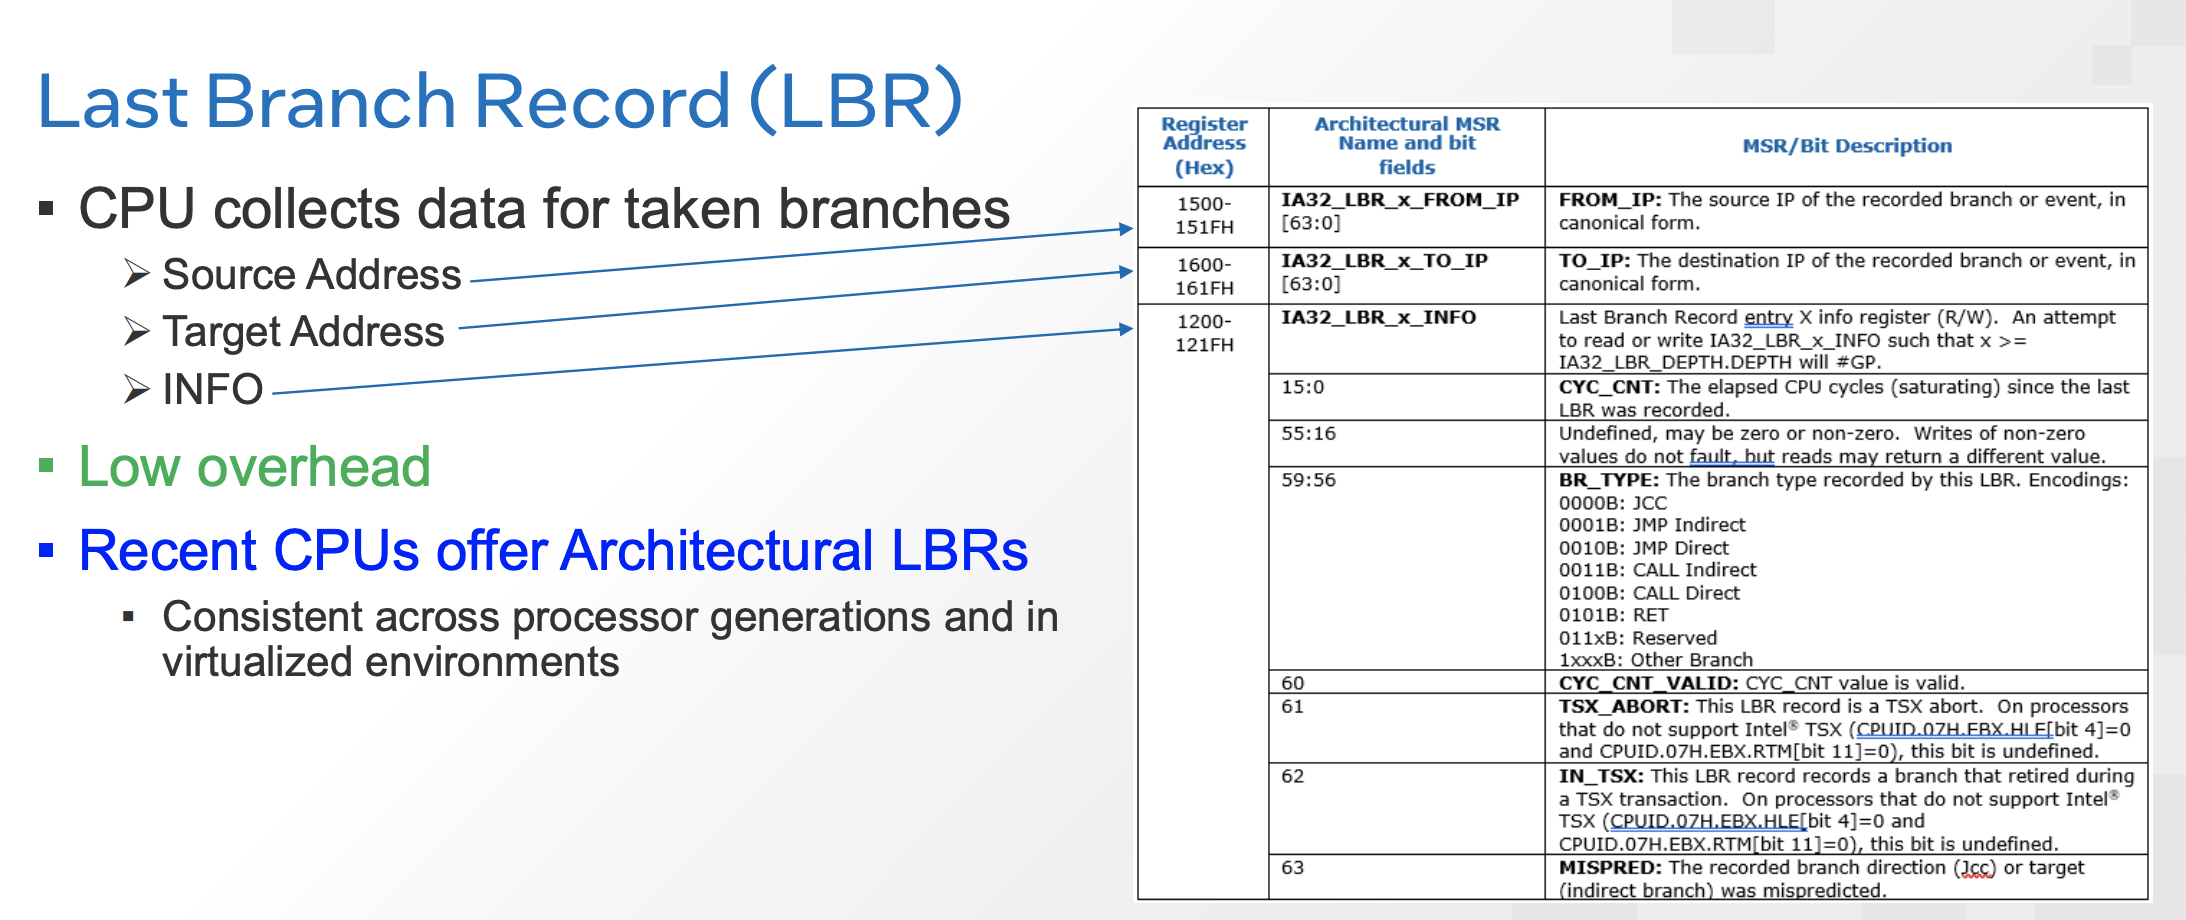
可以把 LBR 想象成一个容量很小的高速暂存器,只记录最近发生的几次分支,但查看速度极快,几乎不影响当前工作。而 BTS 则像一个庞大的流水账本,忠实记录下所有的分支,但往账本上写字的过程本身会消耗一些精力。
Event Filtering
The Event Filtering mechanism provides additional constraints to record events. It is used to filter events not concerned with. For example, latency constraints can be applied in Itanium2’s cache related events, which only count on high latency cache misses. Further, constraints such as “do not capture conditional branches”, “do not capture near return branches” are generally available on recent processors, which support LBR such as Intel Core i7. However, this mechanism is currently only available in LBR, control transfers recorded in BTS lack this type of filtering support.
Conditional Counting
To separate user-level events from kernel-level ones, PMUs also support conditional event counting: they only increment counter while the processor is running at a specific privilege level (e.g. user, kernel or both). Further, to isolate possible interferences in performance counters among multiple processes/threads, operating systems are usually enhanced by saving and restoring performance counters during context switches.
参考资料:
- CFIMon: Detecting Violation of Control Flow Integrity using Performance Counters
- Enabling HW-based PGO
- deepssek prompt: pmu的pebs与lbr,如何理解
- deepssek prompt: Intel Branch Trace Store与Last Branch Record的区别